New Insights visualization in Jira Software
A few months ago, Atlassian introduced a new feature to extract key metrics for team reports: both for dashboards and for the Jira Software Backlog view.
To see these new features, we just need to access a Jira Software project in our instance and select the Insights option, which will be enabled by default.
How to access from the board?
If we are in a “Scrum” type board, we can display the “Insights” column located to the right of the board:

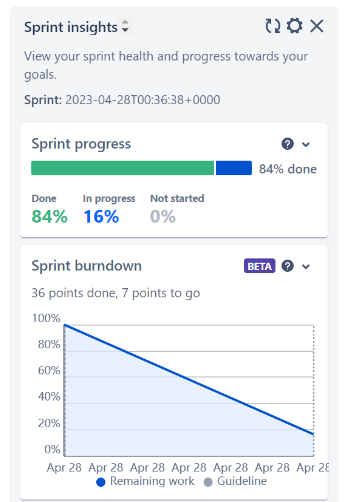
The information shown in this section of our dashboard is as follows:

Sprint progress information or “Sprint progress”: shows the pace of the current sprint and its progress towards the set goal. Teams can see the percentage of work done by each of the states and the percentage of tasks to be completed.
Sprint burndown: shows the “burndown” report in real time, as we resolve each of the user stories and their associated story points. It shows us the guide that we should follow to complete the sprint in time and form according to the objectives set.
Blocked or marked issues: if we have any marked or blocked task, we will also see them highlighted, to pay more attention to them.
Progress of the epics: where each of the epics of the board is and what percentage of resolution have the tasks integrated in those epics.
And new options such as the average “cycle time” of the team or the frequency of deployment of new versions.
Little by little, new options are appearing in beta that are great for us to have all the information accessible in the team follow-up meetings and use the same dashboard screen to see all the necessary information.
How to access from the Backlog?
If we are in the Backlog of a “Scrum” type dashboard, we can display the “Insights” column located to the right of the dashboard:

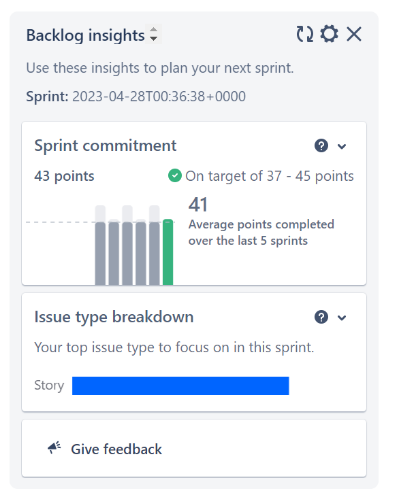
As in the previous case, the column will show us the most representative reports for the team, in this case in the Backlog, when we are planning the Sprint:

Sprint commitment information helps teams plan the right amount of work, so they can meet commitments in a predictable manner. This information monitors the workload of a Sprint based on the performance of the last five Sprints and tracks whether the team’s commitment is over- or under-committed based on the recommended target.
The breakdown by issue type can help teams prioritize work according to overall objectives. With this information, the team can see at a glance the different types of work they are doing, for example, whether they are spending more time addressing issues or developing new features.
How to configure Insights?
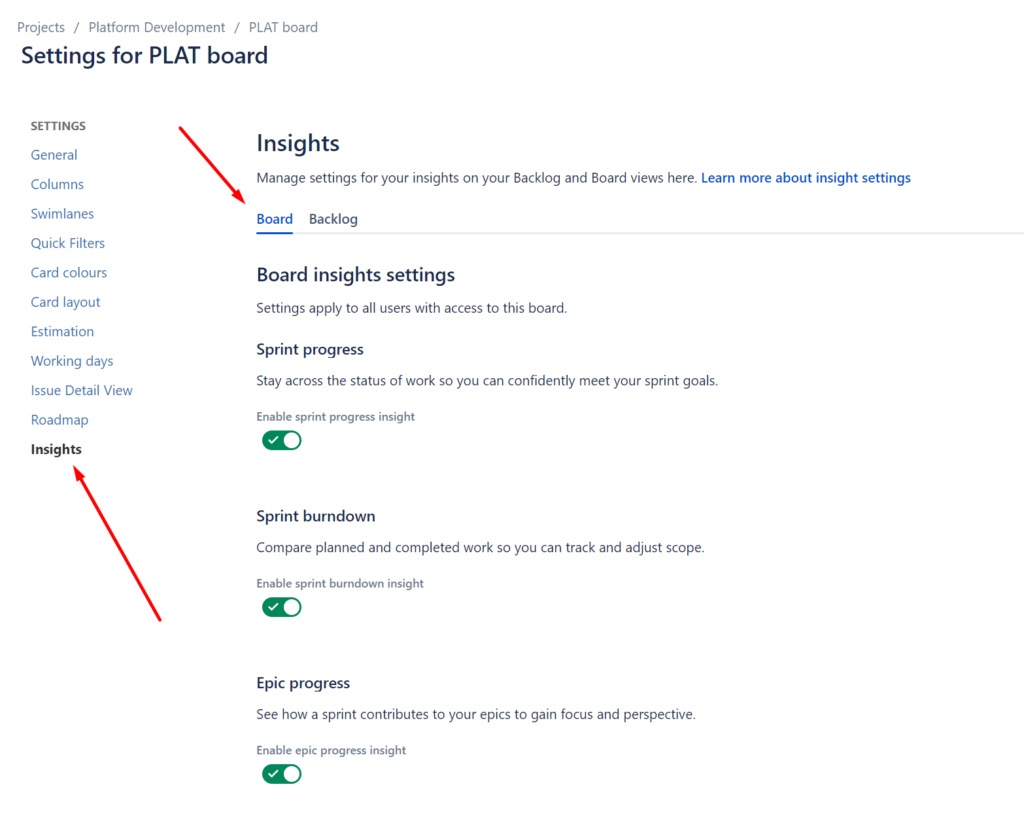
All these widgets accessible from the board and from the Backlog are configurable from the general administration of the board. We can decide which ones we want to see and which ones we want to hide in both cases, thus configuring the view that best suits our needs and above all, the one that provides the most information to facilitate the correct progress of the team.

Of course, Atlassian always tries to give us as much information as possible in a single view, without the need to go to several different views or different menus within the same instance. This makes access to information as agile as possible and there is no excuse to apply the Scrum framework in the best possible way.
We hope you get as much out of it as we do 😉